My Blog
  • Link to Facebook
  • Link to X
  • Link to LinkedIn
  • Link to Youtube
  • Home
  • Search Homes
    • Property Search
    • Featured Listings
    • Open Houses
  • Luxury Homes
  • Communities
    • Scottsdale Ranch
    • McDowell Mountain Ranch
    • DC Ranch
    • Gainey Ranch
    • McCormick Ranch
    • Grayhawk
    • Scottsdale Mountain
    • Ancala
    • View All Communities
  • Buy
    • Experience You Can Rely On
    • Mortgage Calculator
  • Sell
    • Home Value
    • RE/MAX Experience
    • Eight Questions To Ask Any Agent
    • Listing Pointers
  • About
    • About Us
    • Testimonials
    • Market Insights
    • Blog
  • Contact
  • Menu Menu

August 2023 Market Update

October 19, 2023/in Uncategorized/by Brian Bemo

Note: Data below from August, 2023 is the most recent from the National Association of Realtors.

Existing-home sales moved lower in August, according to the National Association of REALTORS®. Among the four major U.S. regions, sales improved in the Midwest, were unchanged in the Northeast, and slipped in the South and West. All four regions recorded year-over-year sales declines.

Total existing home sales – completed transactions that include single-family homes, townhomes, condominiums and co-ops – slid 0.7% from July to a seasonally adjusted annual rate of 4.04 million in August. Year-over-year, sales fell 15.3% (down from 4.77 million in August 2022).
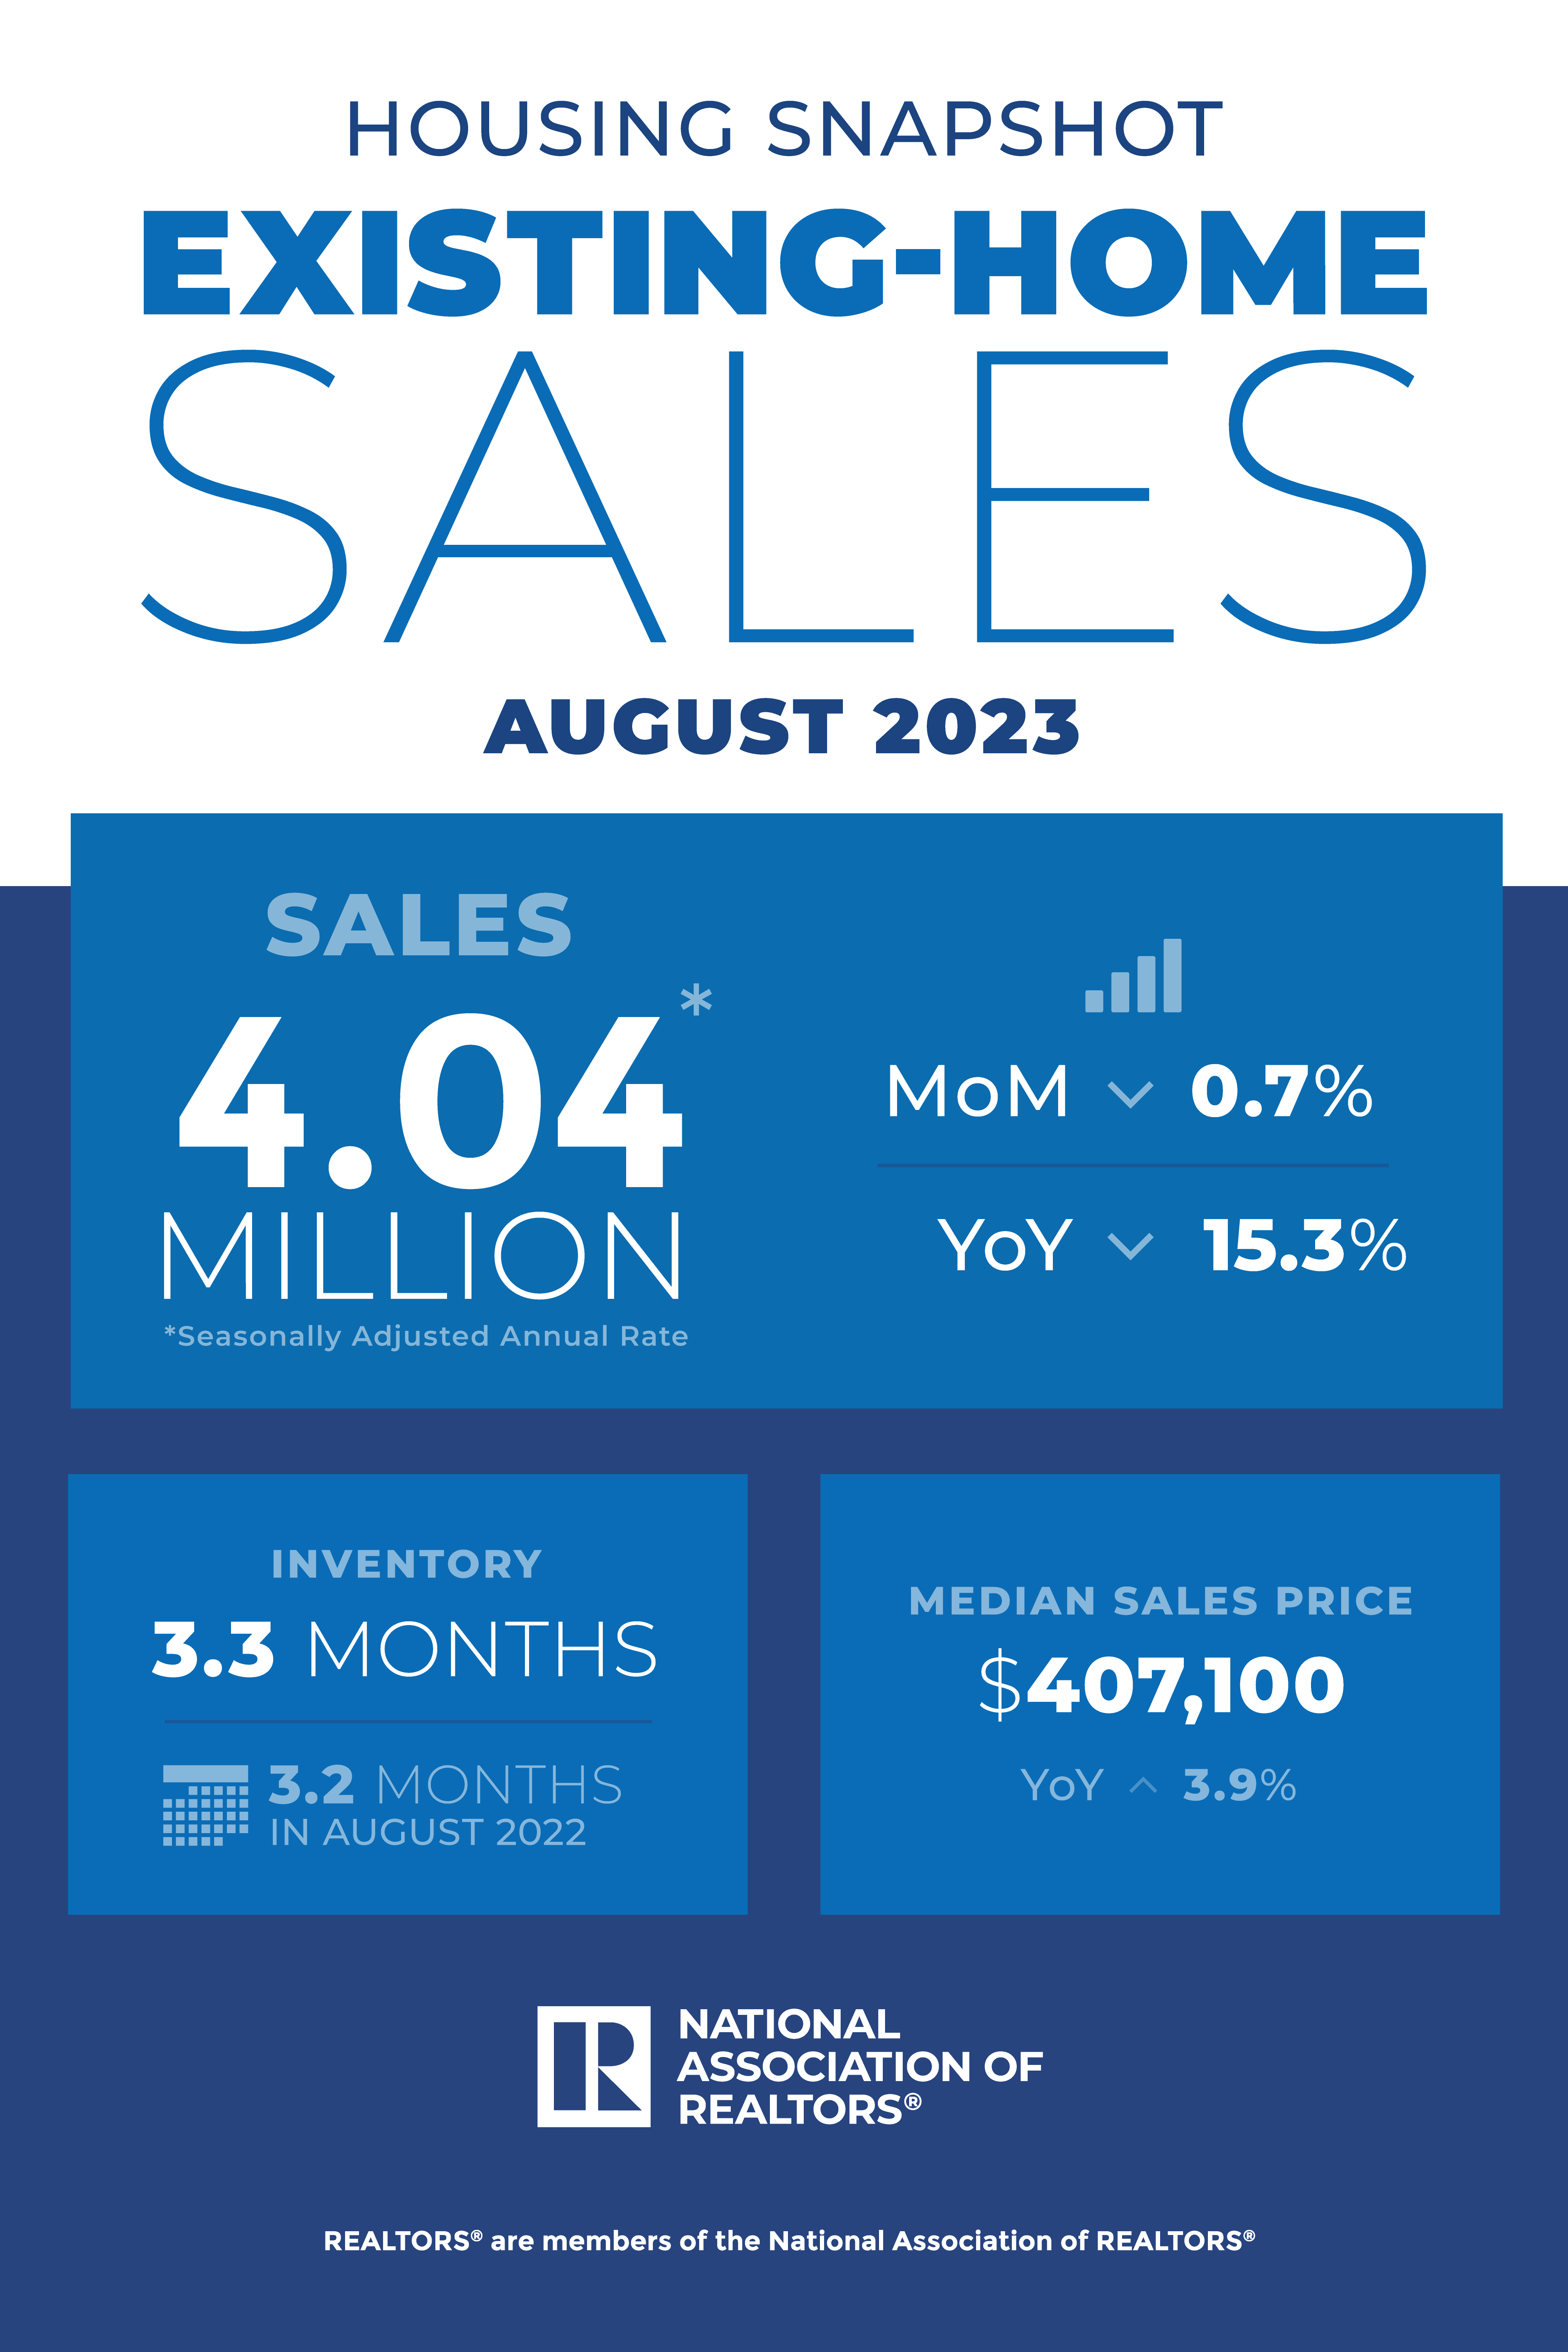
NAR August 2023 Existing Home Sales Report Infographic"Home sales have been stable for several months, neither rising nor falling in any meaningful way," said NAR Chief Economist Lawrence Yun. "Mortgage rate changes will have a big impact over the short run, while job gains will have a steady, positive impact over the long run. The South had a lighter decline in sales from a year ago due to greater regional job growth since coming out of the pandemic lockdown."

Total housing inventory registered at the end of August was 1.1 million units, down 0.9% from July and 14.1% from one year ago (1.28 million). Unsold inventory sits at a 3.3-month supply at the current sales pace, identical to July and up from 3.2 months in August 2022.
 
The median existing-home price for all housing types in August was $407,100, an increase of 3.9% from August 2022 ($391,700). All four U.S. regions posted price increases.
 
"Home prices continue to march higher despite lower home sales," Yun said. "Supply needs to essentially double to moderate home price gains."
 
Properties typically remained on the market for 20 days in August, unchanged from July and up from 16 days in August 2022. Seventy-two percent of homes sold in August were on the market for less than a month.
 
First-time buyers were responsible for 29% of sales in August, down from 30% in July and identical to August 2022. NAR’s 2022 Profile of Home Buyers and Sellers – released in November 2022 – found that the annual share of first-time buyers was 26%, the lowest since NAR began tracking the data.
 
All-cash sales accounted for 27% of transactions in August, up from 26% in July and 24% in August 2022.
 
Individual investors or second-home buyers, who make up many cash sales, purchased 16% of homes in August, the same share as in July and one year ago.
 
According to Freddie Mac, the 30-year fixed-rate mortgage averaged 7.18% as of September 14. That's up from 7.12% the prior week and 6.02% one year ago.
 
 
Regional Breakdown
 
At an annual rate of 480,000 in August, existing-home sales in the Northeast were unchanged from July but down 22.6% from August 2022. The median price in the Northeast was $465,700, up 5.8% from one year ago.
 
In the Midwest, existing-home sales increased by 1.0% from the previous month to an annual rate of 970,000 in August, down 16.4% from the prior year. The median price in the Midwest was $305,300, up 6.8% from August 2022.
 
Existing-home sales in the South faded 1.1% from July to an annual rate of 1.84 million in August, a decrease of 12.4% from one year ago. The median price in the South was $366,100, up 3.2% from August 2022.
 
In the West, existing-home sales slumped 2.6% from the previous month to an annual rate of 750,000 in August, down 15.7% from the prior year. The median price in the West was $609,300, up 1.0% from August 2022.


 

https://awh.armourcloud.io/wp-content/uploads/2026/10/Team-Picarello-Logo-web.png 0 0 Brian Bemo https://awh.armourcloud.io/wp-content/uploads/2026/10/Team-Picarello-Logo-web.png Brian Bemo2023-10-19 19:23:332023-10-19 19:23:33August 2023 Market Update

Pages

  • 2024 Housing Market Forecast [INFOGRAPHIC]
  • About Us
  • Ancala, AZ Homes for Sale
  • Blog
  • Contact
  • Cromford Report
  • DC Ranch, AZ Homes for Sale
  • Desert Highlands, AZ Homes for Sale
  • Eight Questions To Ask Any Agent
  • Estancia, AZ Homes for Sale
  • Experience You Can Rely On
  • Fountain Hills, AZ Homes for Sale
  • Gainey Ranch, AZ Homes for Sale
  • Grayhawk, AZ Homes for Sale
  • Hidden Hills, AZ Homes for Sale
  • Listing Pointers
  • Luxury Homes
  • McCormick Ranch, AZ Homes for Sale
  • McDowell Mountain Ranch, AZ Homes for Sale
  • North Scottsdale Real Estate & Luxury Homes | Team Picarello
  • Pie
  • Pinnacle Peak Country Club, AZ Homes for Sale
  • RE/MAX Experience
  • Sample Page
  • Scottsdale Mountain, AZ Homes for Sale
  • Scottsdale Ranch, AZ Homes for Sale
  • Some Communities We Serve
  • Stonegate, AZ Homes for Sale
  • Testimonials
  • The Wealth-Building Power of Homeownership [INFOGRAPHIC]
  • Troon and Troon North, AZ Homes for Sale
  • Windgate Ranch, AZ Homes for Sale

Categories

  • Uncategorized

Archive

  • August 2026
  • February 2026
  • January 2026
  • December 2025
  • November 2025
  • October 2025
  • September 2025
  • August 2025
  • July 2025
  • June 2025
  • May 2025
  • April 2025
  • March 2025
  • February 2025
  • January 2025
  • December 2024
  • November 2024
  • October 2024
  • September 2024
  • August 2024
  • July 2024
  • June 2024
  • May 2024
  • April 2024
  • March 2024
  • February 2024
  • January 2024
  • December 2023
  • November 2023
  • October 2023
  • September 2023
  • August 2023
  • July 2023
  • June 2023
  • May 2023
  • April 2023
  • March 2023
  • February 2023
  • January 2023
  • December 2022
  • November 2022
  • October 2022
  • September 2022
  • August 2022
  • July 2022
  • June 2022
  • May 2022
  • April 2022
  • March 2022
  • February 2022
  • January 2022
  • December 2021
  • November 2021
  • October 2021
  • September 2021
  • August 2021
  • July 2021
  • June 2021
  • May 2021
  • April 2021
  • March 2021
  • February 2021
  • January 2021
  • December 2020

Copyright © Team Picarello | Scottsdale Website Design & Online Marketing by Bemo Design

  • Link to Facebook
  • Link to X
  • Link to LinkedIn
  • Link to Youtube
Link to: The Difference Between Renting and Buying a Home [INFOGRAPHIC] Link to: The Difference Between Renting and Buying a Home [INFOGRAPHIC] The Difference Between Renting and Buying a Home [INFOGRAPHIC] Link to: The Risks of Selling Your House on Your Own Link to: The Risks of Selling Your House on Your Own The Risks of Selling Your House on Your Own | North Scottsdale Real Estate & Luxury Homes | Team PicarelloThe Risks of Selling Your House on Your Own
Scroll to top Scroll to top Scroll to top