Is Home Price Appreciation Accelerating Again?

At the beginning of the year, industry forecasts called for home price appreciation to slow to about half of the double-digit increase we saw last year. The thinking was that inventory would increase from record-low levels and put an end to the bidding wars that have driven home prices up over the past twelve months. However, that increase in inventory has yet to materialize. The National Association of Realtors (NAR) reports that there are currently 410,000 fewer single-family homes available for sale than there were at this time last year.

This has forced those who made appreciation forecasts this past January to amend those projections. The Mortgage Bankers Association, Fannie Mae, Freddie Mac, the National Association of Realtors, and Zelman & Associates have all adjusted their numbers upward after reviewing first quarter housing data. Here are their original forecasts and their newly updated projections:Is Home Price Appreciation Accelerating Again? | MyKCMEven with the increases, the updated projections still don’t reach the above 10% appreciation levels of 2020. However, a jump in the average projection from 5.3% to 7.7% after just one quarter is substantial. Demand will remain strong, so future appreciation will be determined by how quickly listing inventory makes its way to the market.

Bottom Line

Entering 2021, there was some speculation that we might see price appreciation slow dramatically this year. Today, experts believe that won’t be the case. Home values will remain strong throughout the year.

93% of Americans Believe a Home Is a Better Investment Than Stocks


A recent Survey of Consumer Finances study released by the Federal Reserve reveals the net worth of homeowners is forty times greater than that of renters. If you’re wondering if homeownership is a good investment, the study clearly answers that question, and the answer is yes.

Do Americans believe a home is a better investment than stocks?

In a post on the Liberty Street Economics blog, the Federal Reserve Bank of New York notes that 93.3% of Americans believe buying a home is definitely or probably a better investment than buying stocks.

Here’s how the results break down:93% of Americans Believe a Home Is a Better Investment Than Stocks | MyKCMThe survey also shows a wide range of reasons why Americans feel that way (respondents were able to pick more than one answer):93% of Americans Believe a Home Is a Better Investment Than Stocks | MyKCM

Bottom Line

The data show how strongly Americans believe in homeownership as an investment. That belief is warranted. The Liberty Street Economics blog put it best by saying:

“Housing represents the largest asset owned by most households and is a major means of wealth accumulation, particularly for the middle class.”

Homeownership Is Full of Financial Benefits

A Fannie Mae survey recently revealed some of the most highly-rated benefits of homeownership, which continue to be key drivers in today’s power-packed housing market. Here are the top four financial benefits of owning a home according to consumer respondents:

88% – a better chance of saving for retirement
87% – the best investment plan
85% – the chance to be better off financially
85% – the chance to build up wealth
Additional financial advantages of homeownership included in the survey are having the best overall tax situation and being able to live within your budget.

Does homeownership actually give you a better chance to build wealth?

No one can question a person’s unique feelings about the importance of homeownership. However, it’s fair to ask if the numbers justify homeownership as a financial asset.

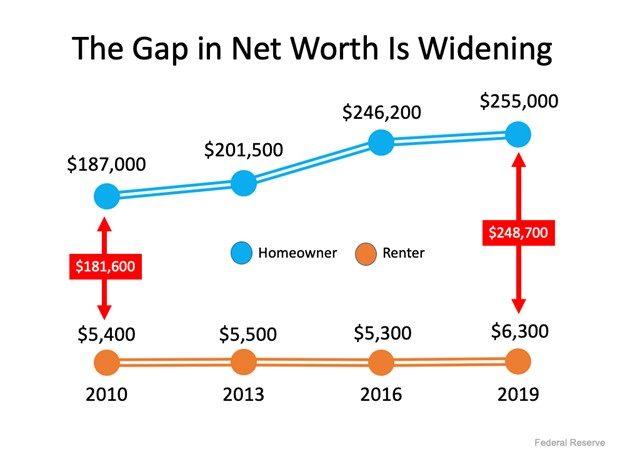
Last fall, the Federal Reserve released the Survey of Consumer Finances, a report done every three years, with the latest edition covering through 2019. Their findings confirmed that homeownership is a clear financial benefit. The survey found that homeowners have forty times higher net worth than renters ($255,000 for homeowners compared to $6,300 for renters).

The difference in net worth between homeowners and renters has continued to grow. Here’s a graph showing the results of the last four Fed surveys:

Homeownership Is Full of Financial Benefits | North Scottsdale Real Estate & Luxury Homes | Team Picarello


The above graph only includes data through 2019, but according to CoreLogic, the equity held by homeowners grew by $26,300 over the last twelve months alone. That means the gap between the net worth of homeowners and renters has probably widened even further over the last year.

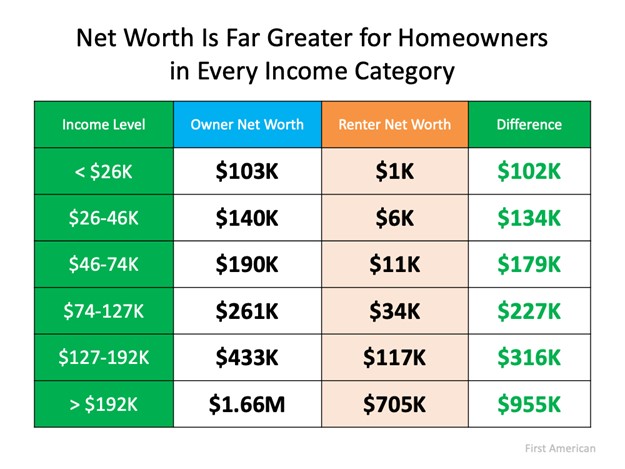
Some might argue the difference in net worth may be due to homeowners normally having larger incomes than renters and therefore the ability to save more money. However, a study by First American shows homeowners have greater net worth than renters regardless of their income level. Here are the findings:

Homeownership Is Full of Financial Benefits | North Scottsdale Real Estate & Luxury Homes | Team Picarello

Others may think homeowners are older and that’s why they have a greater net worth. However, a Joint Center for Housing Studies of Harvard University report on homeowners and renters over the age of 65 reveals:

“The ability to build equity puts homeowners far ahead of renters in terms of household wealth…the median owner age 65 and over had home equity of $143,500 and net wealth of $319,200. By comparison, the net wealth of the same-age renter was just $6,700.”

Homeowners 65 and older have 47.6 times greater net worth than renters.

Bottom Line
The idea of homeownership as a direct way to build your net worth has met the test of time. Let’s connect if you’re ready to take steps toward becoming a homeowner.

February 2021 Market Update

Note: February 2021 data below are the most recent released by the National Association of Realtors.

Existing-home sales declined in February, following two prior months of gains, according to the National Association of Realtors®. Month-over-month, only one major region saw an increase in February, but all four U.S. regions recorded year-over-year gains.

Total existing-home sales (transactions that include single-family homes, townhomes, condominiums and co-ops) decreased 6.6% from January to a seasonally-adjusted annual rate of 6.22 million in February. Sales in total climbed year-over-year, up 9.1% from a year ago (5.70 million in February 2020).

National Association of Realtors February 2021 Data

"Despite the drop in home sales for February – which I would attribute to historically-low inventory – the market is still outperforming pre-pandemic levels," said Lawrence Yun, NAR’s chief economist.
 
He cautioned of a possible slowdown in growth in the coming months as higher prices and rising mortgage rates will cut into home affordability.
 
"I still expect this year’s sales to be ahead of last year's, and with more COVID-19 vaccinations being distributed and available to larger shares of the population, the nation is on the cusp of returning to a sense of normalcy," Yun said. "Many Americans have been saving money and there's a strong possibility that once the country fully reopens, those reserves will be unleashed on the economy."

The median existing-home price for all housing types in February was $313,000, up 15.8% from February 2020 ($270,400), as prices rose in every region. February's national price jump marks 108 straight months of year-over-year gains.

"Home affordability is weakening," Yun said. "Various stimulus packages are expected and they will indeed help, but an increase in inventory is the best way to address surging home costs."

Total housing inventory at the end of February amounted to 1.03 million units, equal to January’s inventory and down 29.5% from one year ago (1.46 million). Unsold inventory sits at a 2.0-month supply at the current sales pace, slightly up from January’s 1.9-month supply and down from the 3.1-month amount recorded in February 2020. NAR first began tracking the single-family home supply in 1982.

Properties typically remained on the market for 20 days in February, down from both 21 days in January and from 36 days in February 2020. Seventy-four percent of the homes sold in February 2021 were on the market for less than a month.

First-time buyers were responsible for 31% of sales in February, down from 33% in January and from 32% in February 2020. NAR's 2020 Profile of Home Buyers and Sellers revealed that the annual share of first-time buyers was 31%.

Individual investors or second-home buyers, who account for many cash sales, purchased 17% of homes in February, up from 15% in January and equal to the percentage from February 2020. All-cash sales accounted for 22% of transactions in February, up from both 19% in January and from 20% in February 2020.

"This year, we've seen fair housing protections extended, recognized Realtors®' remarkable volunteerism, and are collaborating with policymakers to increase revitalization endeavors in numerous neighborhoods," said NAR President Charlie Oppler, a Realtor® from Franklin Lakes, N.J., and the CEO of Prominent Properties Sotheby’s International Realty. "We have made an incredible amount of notable progress thus far in 2021, and NAR is committed and encouraged to continue those efforts."
 
According to Freddie Mac, the average commitment rate for a 30-year, conventional, fixed-rate mortgage was 2.81 in February, up from 2.74% in January. The average commitment rate across all of 2020 was 3.11%.


 

There’s No Reason To Panic Over Today’s Lending Standards


Today, some are afraid the real estate market is starting to look a lot like it did in 2006, just prior to the housing crash. One of the factors they’re pointing to is the availability of mortgage money. Recent articles about the availability of low down payment loans and down payment assistance programs are causing fear that we’re returning to the bad habits seen 15 years ago. Let’s alleviate these concerns.

Several times a year, the Mortgage Bankers Association releases an index titled The Mortgage Credit Availability Index (MCAI). According to their website:

“The MCAI provides the only standardized quantitative index that is solely focused on mortgage credit. The MCAI is…a summary measure which indicates the availability of mortgage credit at a point in time.”

Basically, the index determines how easy it is to get a mortgage. The higher the index, the more available mortgage credit becomes. Here’s a graph of the MCAI dating back to 2004, when the data first became available:There’s No Reason To Panic Over Today's Lending Standards | MyKCMAs we can see, the index stood at about 400 in 2004. Mortgage credit became more available as the housing market heated up, and then the index passed 850 in 2006. When the real estate market crashed, so did the MCAI (to below 100) as mortgage money became almost impossible to secure. Thankfully, lending standards have eased somewhat since. The index, however, is still below 150, which is about one-sixth of what it was in 2006.

Why did the index rage out of control during the housing bubble?

The main reason was the availability of loans with extremely weak lending standards. To keep up with demand in 2006, many mortgage lenders offered loans that put little emphasis on the eligibility of the borrower. Lenders were approving loans without always going through a verification process to confirm if the borrower would likely be able to repay the loan.

Some of these loans offered attractive, low interest rates that increased over time. The loans were popular because they could be obtained quickly and without the borrower having to provide documentation up front. However, as the rates increased, borrowers struggled to pay their mortgages.

Today, lending standards are much tighter. As Investopedia explains, the risky loans given at that time are extremely rare today, primarily because lending standards have drastically improved:

“In the aftermath of the crisis, the U.S. government issued new regulations to improve standard lending practices across the credit market, which included tightening the requirements for granting loans.”

An example of the relaxed lending standards leading up to the housing crash is the FICO® credit score associated with a loan. What’s a FICO® score? The website myFICO explains:

“A credit score tells lenders about your creditworthiness (how likely you are to pay back a loan based on your credit history). It is calculated using the information in your credit reports. FICO® Scores are the standard for credit scores—used by 90% of top lenders.”

During the housing boom, many mortgages were written for borrowers with a FICO score under 620. Experian reveals that, in today’s market, lenders are more cautious about lower credit scores:

“Statistically speaking, 28% of consumers with credit scores in the Fair range are likely to become seriously delinquent in the future…Some lenders dislike those odds and choose not to work with individuals whose FICO® Scores fall within this range.”

There are definitely still loan programs that allow a 620 score. However, lending institutions overall are much more attentive about measuring risk when approving loans. According to Ellie Mae’s latest Origination Insight Report, the average FICO® score on all loans originated in February was 753.

The graph below shows the billions of dollars in mortgage money given annually to borrowers with a credit score under 620.There’s No Reason To Panic Over Today's Lending Standards | MyKCMIn 2006, mortgage entities originated $376 billion dollars in loans for purchasers with a score under 620. Last year, that number was only $74 billion.

Bottom Line

In 2006, lending standards were much more relaxed with little evaluation done to measure a borrower’s potential to repay their loan. Today, standards are tighter, and the risk is reduced for both lenders and borrowers. These are two very different housing markets, so there’s no need to panic over today’s lending standards.