January 2024 Market Update
<p>
<span style=”font-family:arial,helvetica,sans-serif;”><span style=”font-size:10pt;”><em><strong>Note: Data below from January 2024 is the most recent from the National Association of Realtors.</strong></em></span></span></p>
<p>
<span style=”font-size:14pt;”><span style=”font-family:arial,helvetica,sans-serif;”>Existing-home sales grew in January, according to the National Association of REALTORS®. Among the four major U.S. regions, sales accelerated in the Midwest, South and West, and remained steady in the Northeast. Year-over-year, sales improved in the West, and decreased in the Northeast, Midwest and South.</span></span></p>
<p>
<span style=”font-size:14pt;”><span style=”font-family:arial,helvetica,sans-serif;”>Total existing home sales – completed transactions that include single-family homes, townhomes, condominiums and co-ops - elevated 3.1% from December to a seasonally adjusted annual rate of 4.00 million in January. Year-over-year, sales slipped 1.7% (down from 4.07 million in January 2023).</span></span><br />
<br />
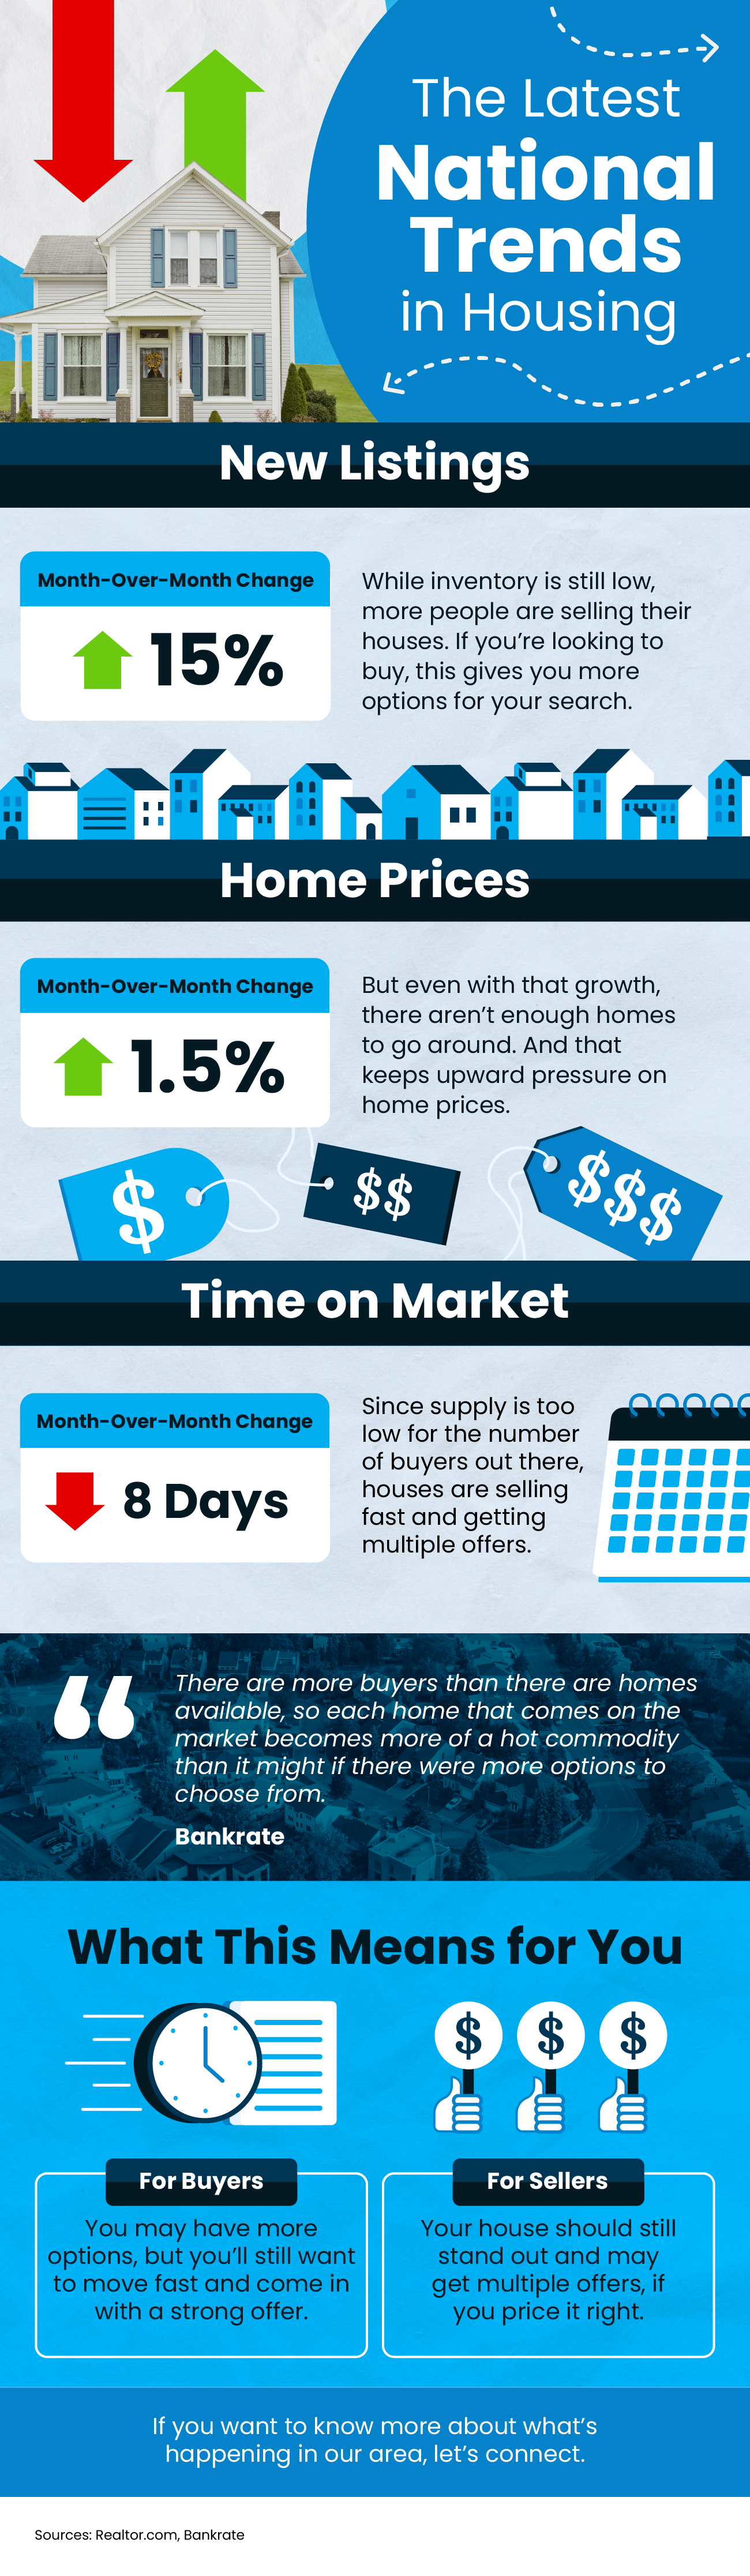
<span style=”font-size:14pt;”><span style=”font-family:arial,helvetica,sans-serif;”><img alt=”NAR January 2024 Existing Home Sales Report Infographic” src=”https://www.ihomefinder.com/wp-content/uploads/2024/03/2024-01-existing-home-sales-housing-snapshot-infographic-02-22-2024-1000w-1500h.png” style=”float: right; margin: 4px 10px; height: 321px; width: 214px;” />"While home sales remain sizably lower than a couple of years ago, January's monthly gain is the start of more supply and demand," said NAR Chief Economist Lawrence Yun. "Listings were modestly higher, and home buyers are taking advantage of lower mortgage rates compared to late last year."</span></span></p>
<div>
<span style=”font-size:14pt;”><span style=”font-family:arial,helvetica,sans-serif;”>Total housing inventory registered at the end of January was 1.01 million units, up 2.0% from December and 3.1% from one year ago (980,000). Unsold inventory sits at a 3.0-month supply at the current sales pace, down from 3.1 months in December but up from 2.9 months in January 2023.</span></span></div>
<div>
</div>
<div>
<span style=”font-size:14pt;”><span style=”font-family:arial,helvetica,sans-serif;”>The median existing-home price for all housing types in January was $379,100, an increase of 5.1% from one year ago ($360,800). All four U.S. regions posted price increases.</span></span></div>
<div>
</div>
<div>
<span style=”font-size:14pt;”><span style=”font-family:arial,helvetica,sans-serif;”>"The median home price reached an all-time high for the month of January," Yun added. "Multiple offers are common on mid-priced homes, and many homes were still sold within a month. The elevated share of cash deals – 32% – indicated a market full of multiple offers and propelled by record-high housing wealth."</span></span></div>
<div>
</div>
<div>
<span style=”font-size:14pt;”><span style=”font-family:arial,helvetica,sans-serif;”>According to the REALTORS® Confidence Index, properties typically remained on the market for 36 days in January, up from 29 days in December and 33 days in January 2023.</span></span></div>
<div>
</div>
<div>
<span style=”font-size:14pt;”><span style=”font-family:arial,helvetica,sans-serif;”>First-time buyers were responsible for 28% of sales in January, down from 29% in December and 31% in January 2023. NAR's 2023 Profile of Home Buyers and Sellers – released in November 20234 – found that the annual share of first-time buyers was 32%.</span></span></div>
<div>
</div>
<div>
<span style=”font-size:14pt;”><span style=”font-family:arial,helvetica,sans-serif;”>All-cash sales accounted for 32% of transactions in January, up from 29% in both December and one year ago.</span></span><br />
</div>
<div>
<span style=”font-size:14pt;”><span style=”font-family:arial,helvetica,sans-serif;”>Individual investors or second-home buyers, who make up many cash sales, purchased 17% of homes in January, up from 16% in December and January 2023.</span></span></div>
<div>
</div>
<div>
<span style=”font-size:16pt;”><span style=”font-size:14pt;”><span style=”font-family:arial,helvetica,sans-serif;”>According to Freddie Mac, the <a href=”https://www.freddiemac.com/pmms” target=”_blank”>30-year fixed-rate mortgage</a> averaged </span></span></span><span style=”font-size:14pt;”><span style=”font-family:arial,helvetica,sans-serif;”>6.77% as of February 15. That's up from 6.64% the previous week and 6.32% one year ago.</span></span></div>
<div>
</div>
<div>
<div>
</div>
<div>
<span style=”font-family:arial,helvetica,sans-serif;”><span style=”font-size:14pt;”><strong>Regional Breakdown</strong></span></span></div>
<div>
</div>
<div>
<div>
<span style=”font-size:14pt;”><span style=”font-family:arial,helvetica,sans-serif;”>At 480,000 units, existing-home sales in the Northeast were unchanged from December but down 5.9% from January 2023. The median price in the Northeast was $434,300, up 10.1% from the prior year.</span></span></div>
<div>
</div>
<div>
<span style=”font-size:14pt;”><span style=”font-family:arial,helvetica,sans-serif;”>In the Midwest, existing-home sales increased 2.2% from one month ago to an annual rate of 950,000 in January, down 3.1% from last year. The median price in the Midwest was $271,700, up 7.6% from January 2023.</span></span></div>
<div>
</div>
<div>
<span style=”font-size:14pt;”><span style=”font-family:arial,helvetica,sans-serif;”>Existing-home sales in the South rose 4.0% from December to an annual rate of 1.84 million in January, a decline of 1.6% from the previous year. The median price in the South was $345,100, up 4.1% from one year ago.</span></span></div>
<div>
</div>
<div>
<span style=”font-size:14pt;”><span style=”font-family:arial,helvetica,sans-serif;”>In the West, existing-home sales elevated 4.3% from a month ago to an annual rate of 730,000 in January and grew 2.8% from one year earlier. The median price in the West was $572,100, up 6.3% from January 2023.</span></span></div>
<div>
</div>
</div>
</div>
<p>
</p>