
What Do Past Years Tell Us About Today’s Real Estate Market?

As you follow the news, you’re likely seeing headlines discussing what’s going on in today’s housing market. Chances are high that some of the more recent storylines you’ve come across mention terms like cooling or slowing when talking about where the market is headed.

But what do these terms mean? The housing market today is anything but normal, and it’s still an incredibly strong sellers’ market, especially when compared to the few years leading up to the pandemic. With that in mind, what can previous years tell us about today’s real estate market and if it’s truly slowing?

We’re Still Seeing an Above Average Number of Sales

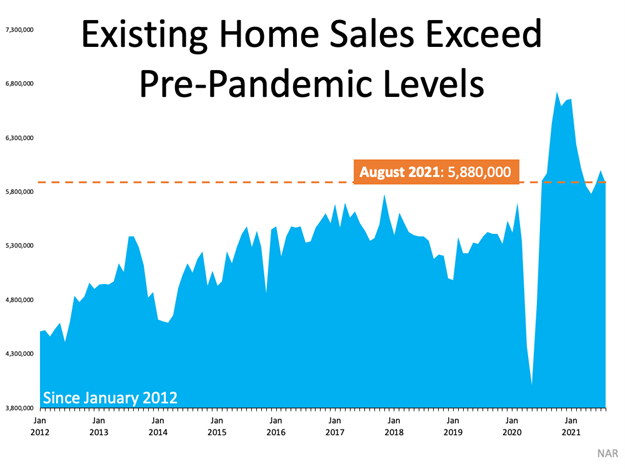
You may see headlines about a drop in home sales. But are those headlines telling the full story? The most recent Existing Home Sales Report from the National Association of Realtors (NAR) does show a drop of about 2% from July to August. But the month-over-month decline doesn’t provide the full picture (see graph below):As the graph shows, historical context is key. Today’s home sales are well ahead of some of the more normal years that led up to the health crisis. That means buyers are still in the market, which is great news if you’re planning to list your home.
What Do Past Years Tell Us About Today’s Real Estate Market? | North Scottsdale Real Estate & Luxury Homes | Team Picarello

Houses Are Selling Faster Than Usual

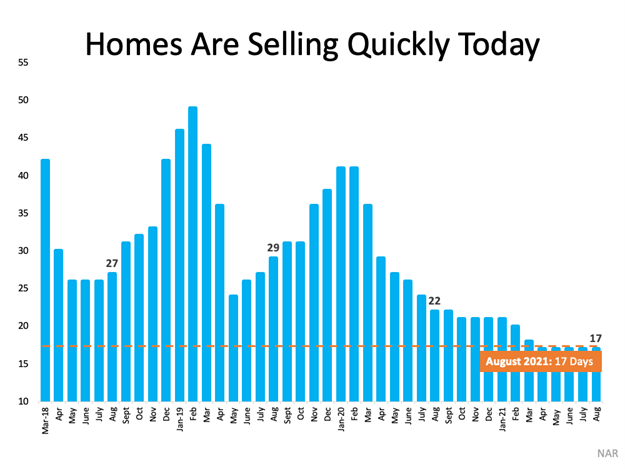
When headlines mention the market is slowing, sellers may naturally wonder if their house will sell as quickly as they’d like. According to the most recent Realtors Confidence Index from NAR, homes are still selling at record speed (see graph below):Again, if we look back at data from previous years, we can see the average time on market – 17 days –  means homes are selling faster than a normal pace.
What Do Past Years Tell Us About Today’s Real Estate Market? | North Scottsdale Real Estate & Luxury Homes | Team Picarello

Bidding Wars Are Still the Norm

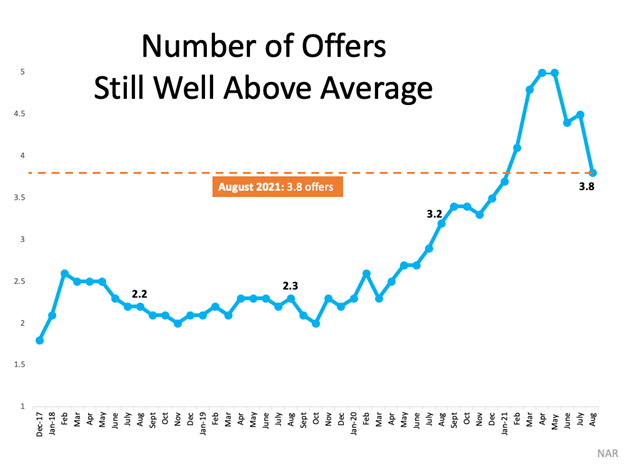
The Realtors Confidence Index from NAR also shows a drop in the average number of offers homes are receiving in August, and many headlines may simply focus there without providing the important context (see graph below):Again, it’s important to compare today’s market to trends from recent years. Currently, the average number of offers per listing is higher than 39 of the previous 45 months. That means the likelihood of a bidding war on your home is still high. And the number of offers your house receives can have a major influence on the final sale price.
What Do Past Years Tell Us About Today’s Real Estate Market? | North Scottsdale Real Estate & Luxury Homes | Team Picarello

So, Is the Market Slowing Down?

While there are slight declines in various month-to-month data, it’s important to keep historical context in mind when determining what’s happening in today’s market. Odeta Kushi, Deputy Chief Economist at First American, put it best recently, saying:

“It’s not the white-hot market from earlier in the year & it’s not the 2020 market benefiting from a wave of pent-up demand but make no mistake this is still a hot housing market.”

Bottom Line

Don’t let headlines make you rethink listing your home this fall. Selling today means you can still take advantage of high buyer demand, multiple offers, and a quick sale. If you’re thinking of selling your house, let’s connect and discuss why this fall is the perfect time to do so.

August 2021 Market Update

Note: August 2021 data below are the most recent released by the National Association of Realtors.

Existing-home sales retreated in August, breaking two straight months of increases, according to the National Association of Realtors®. Each of the four major U.S. regions experienced declines on both a month-over-month and a year-over-year perspective.

Total existing-home sales (transactions that include single-family homes, townhomes, condominiums and co-ops) fell 2.0% from July to a seasonally adjusted annual rate of 5.88 million in August. Year-over-year, sales dropped 1.5% from a year ago (5.97 million in August 2020).

National Association of Realtors August 2021 Data

"Sales slipped a bit in August as prices rose nationwide," said Lawrence Yun, NAR's chief economist. "Although there was a decline in home purchases, potential buyers are out and about searching, but much more measured about their financial limits, and simply waiting for more inventory."

Total housing inventory at the end of August totaled 1.29 million units, down 1.5% from July's supply and down 13.4% from one year ago (1.49 million). Unsold inventory sits at a 2.6-month supply at the current sales pace, unchanged from July but down from 3.0 months in August 2020.

The median existing-home price for all housing types in August was $356,700, up 14.9% from August 2020 ($310,400), as prices increased in each region. This marks 114 straight months of year-over-year gains.

"High home prices make for an unbalanced market, but prices would normalize with more supply," Yun said.

Properties typically remained on the market for 17 days in August, unchanged from July and down from 22 days in August 2020. Eighty-seven percent of homes sold in August 2021 were on the market for less than a month.

First-time buyers were responsible for 29% of sales in August, down from 30% in July and 33% in August 2020. NAR's 2020 Profile of Home Buyers and Sellers revealed that the annual share of first-time buyers was 31%.

"Securing a home is still a major challenge for many prospective buyers," said Yun. "A number of potential buyers have merely paused their search, but their desire and need for a home remain."
 
Moreover, a recent study from NAR found that student loan debt is preventing the majority of non-owner millennials and those making over $100,000 from buying a home.

Individual investors or second-home buyers, who account for many cash sales, purchased 15% of homes in August, even with July but up from 14% in August 2020. All-cash sales accounted for 22% of transactions in August, down from 23% in July and up from 18% in August 2020.

According to Freddie Mac, the average commitment rate for a 30-year, conventional, fixed-rate mortgage was 2.84% in August, down from 2.87% in July. The average commitment rate across all of 2020 was 3.11%.