August 2021 Market Update

Note: August 2021 data below are the most recent released by the National Association of Realtors.

Existing-home sales retreated in August, breaking two straight months of increases, according to the National Association of Realtors®. Each of the four major U.S. regions experienced declines on both a month-over-month and a year-over-year perspective.

Total existing-home sales (transactions that include single-family homes, townhomes, condominiums and co-ops) fell 2.0% from July to a seasonally adjusted annual rate of 5.88 million in August. Year-over-year, sales dropped 1.5% from a year ago (5.97 million in August 2020).

National Association of Realtors August 2021 Data

"Sales slipped a bit in August as prices rose nationwide," said Lawrence Yun, NAR's chief economist. "Although there was a decline in home purchases, potential buyers are out and about searching, but much more measured about their financial limits, and simply waiting for more inventory."

Total housing inventory at the end of August totaled 1.29 million units, down 1.5% from July's supply and down 13.4% from one year ago (1.49 million). Unsold inventory sits at a 2.6-month supply at the current sales pace, unchanged from July but down from 3.0 months in August 2020.

The median existing-home price for all housing types in August was $356,700, up 14.9% from August 2020 ($310,400), as prices increased in each region. This marks 114 straight months of year-over-year gains.

"High home prices make for an unbalanced market, but prices would normalize with more supply," Yun said.

Properties typically remained on the market for 17 days in August, unchanged from July and down from 22 days in August 2020. Eighty-seven percent of homes sold in August 2021 were on the market for less than a month.

First-time buyers were responsible for 29% of sales in August, down from 30% in July and 33% in August 2020. NAR's 2020 Profile of Home Buyers and Sellers revealed that the annual share of first-time buyers was 31%.

"Securing a home is still a major challenge for many prospective buyers," said Yun. "A number of potential buyers have merely paused their search, but their desire and need for a home remain."
 
Moreover, a recent study from NAR found that student loan debt is preventing the majority of non-owner millennials and those making over $100,000 from buying a home.

Individual investors or second-home buyers, who account for many cash sales, purchased 15% of homes in August, even with July but up from 14% in August 2020. All-cash sales accounted for 22% of transactions in August, down from 23% in July and up from 18% in August 2020.

According to Freddie Mac, the average commitment rate for a 30-year, conventional, fixed-rate mortgage was 2.84% in August, down from 2.87% in July. The average commitment rate across all of 2020 was 3.11%.


The Truth About Today’s Buyer Demand

When it comes to the latest news in real estate, there are a lot of sensational headlines in the media. In times like this, when it can be hard to know what to believe, put your trust in the experts. Those of us in the housing market respect that buying or selling a home is a major life decision, and we offer advice based on what the data shows.

Despite what you may have read, the housing market is still undeniably strong. Here’s a look at what leading experts have to say about buyer demand today and how it continues to shape the industry:

Michael Lane, President at ShowingTime:

“In general, there are definite signs of cooling demand. However, buyer traffic is still at historically high levels compared to pre-pandemic showings.”

Odeta Kushi, Deputy Chief Economist at First American:

“Seasonally adjusted purchase applications tick up slightly to the highest level since July. Demand for homes remains strong and steady. Excluding 2020 (not a good benchmark) purchase applications are the strongest in a decade.” 

Selma Hepp, Deputy Chief Economist at CoreLogic:

“Home buyer demand pushed price growth to a new record high in June, with S&P CoreLogic national Case-Shiller Index clocking in an 18.6% year-over-year growth rate. The month-to-month index jumped 2.18%, making it another strong monthly growth, and the fastest May-to-June increase since the data series began.”

What It Means for You

As a seller, buyer demand is an important factor that helps influence how fast your house will sell and how many buyers may be competing for it. When buyers have to compete against each other for a limited supply of available homes, bidding wars can drive prices up. While things have cooled slightly since the peak of the pandemic housing rush, buyer demand is still far surpassing historical norms. That’s why we’re still in a sellers’ market.

Bottom Line

If you’re torn on whether or not you want to sell your home this year, rest assured it’s still a great time to make a move. Let’s connect to discuss how you can sell now and do it on your best terms thanks to today’s buyer demand.

July 2021 Market Update

Note: July 2021 data below are the most recent released by the National Association of Realtors.

Existing-home sales rose in July, marking two consecutive months of increases, according to the National Association of Realtors®. Three of the four major U.S. regions recorded modest month-over-month gains, and the fourth remained level. Figures varied from a year-over-year perspective as two regions saw gains, one witnessed a decline and one was unchanged.

Total existing-home sales (transactions that include single-family homes, townhomes, condominiums and co-ops) grew 2.0% from June to a seasonally adjusted annual rate of 5.99 million in July. Sales inched up year-over-year, increasing 1.5% from a year ago (5.90 million in July 2020).

National Association of Realtors July 2021 Data

"We see inventory beginning to tick up, which will lessen the intensity of multiple offers," said Lawrence Yun, NAR's chief economist. "Much of the home sales growth is still occurring in the upper-end markets, while the mid- to lower-tier areas aren't seeing as much growth because there are still too few starter homes available."

Total housing inventory at the end of July totaled 1.32 million units, up 7.3% from June's supply and down 12.0% from one year ago (1.50 million). Unsold inventory sits at a 2.6-month supply at the present sales pace, up slightly from the 2.5-month figure recorded in June but down from 3.1 months in July 2020.

The median existing-home price for all housing types in July was $359,900, up 17.8% from July 2020 ($305,600), as each region saw prices climb. This marks 113 straight months of year-over-year gains.

"Although we shouldn't expect to see home prices drop in the coming months, there is a chance that they will level off as inventory continues to gradually improve," said Yun.
 
"In the meantime, some prospective buyers who are priced out are raising the demand for rental homes and thereby pushing up the rental rates," he added.

Properties typically remained on the market for 17 days in July, unchanged from June and down from 22 days in July 2020. Eighty-nine percent of homes sold in July 2021 were on the market for less than a month.

First-time buyers were responsible for 30% of sales in July, down from 31% in June and down from 34% in July 2020. NAR's 2020 Profile of Home Buyers and Sellers revealed that the annual share of first-time buyers was 31%.

Individual investors or second-home buyers, who account for many cash sales, purchased 15% of homes in July, up from 14% in June but even with 15% from July 2020. All-cash sales accounted for 23% of transactions in July, even with June and up from 16% in July 2020.

According to Freddie Mac, the average commitment rate for a 30-year, conventional, fixed-rate mortgage was 2.87% in July, marginally down from 2.98% in June. The average commitment rate across all of 2020 was 3.11%.

"As more homes come on the market, opportunities for prospective buyers continue to increase in regions across the country," said NAR President Charlie Oppler, a Realtor® from Franklin Lakes, N.J., and the CEO of Prominent Properties Sotheby's International Realty. "But even though we are beginning to see some normalcy return, NAR continues to work alongside legislators and policymakers to ensure we are doing everything we can to boost the supply of safe, affordable housing in America."

Real Estate: It’s Still a Lack of Supply, Not a Lack of Demand

One of the major questions real estate experts are asking today is whether prospective homebuyers still believe purchasing a home makes sense. Some claim rapidly rising home prices are impacting demand and, by extension, leading to the recent slowdown in sales activity.

However, demand isn’t the real issue. Instead, it’s the lack of supply (homes available for sale). An article from the Wall Street Journal shows this is true for new home construction:

“Home builders have sold more homes than they can build. Now they are limiting their sales in an effort to catch up.”

The article quotes David Auld, CEO of D.R. Horton Inc. (the largest homebuilder by volume in the United States since 2002), explaining how they don’t have enough homes for the number of buyers coming into their models:

“Through our history, to have somebody walk into our models and to tell them, ‘We don’t have a house for you to buy today’, is something that is foreign to us.”

Danielle Hale, Chief Economist for realtor.com, also explains that, in the existing home sale market, the slowdown in sales was a supply challenge, not a lack of demand. Responding to a recent uptick in listings coming to market, she notes:

“. . . if these changing inventory dynamics continue, we could see a wave of real estate activity heading into the latter part of the year.”

Again, the buyers are there. We just need houses to sell to them.

If the slowdown in sales was the result of demand waning, we would start to see home prices beginning to moderate – but this isn’t the case. As Mark Fleming, Chief Economist for First American, explains:

“There’s a lot of conversation around rising prices and falling quantity in the housing market, and there’s this concept, or this idea, that it’s a demand-side problem . . . . But, if demand were falling dramatically, we would actually see less price pressure, less home price growth.”

Instead, we’re seeing price appreciation accelerate throughout this year, as evidenced by the year-over-year percentage increases reported by CoreLogic:

  • January: 10%
  • February: 10.4%
  • March: 11.3%
  • April: 13%
  • May: 15.4%
  • June: 17.2%

(July numbers are not yet available)

There’s a shortage of listings, not buyers, and there are three very good reasons for purchasers to still be interested in buying a home this year.

  1. Affordability isn’t the challenge some are claiming it to be.

Though home prices have risen dramatically over the last 18 months, mortgage rates remain near historic lows. Because of these near-record rates, monthly mortgage payments are affordable for most buyers.

While homes are less affordable than they were last year, when we adjust for inflation, we can see they’re also more affordable than they were in the 1970s, 1980s, 1990s, and much of the 2000s.

  1. Owning is a better long-term decision than renting.

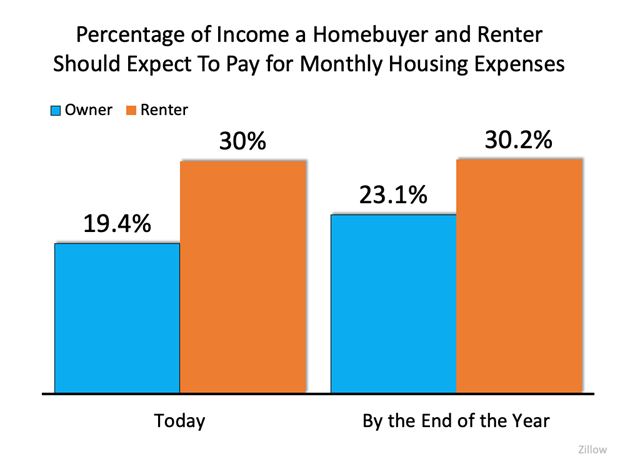
A recent study shows renting a home takes up a higher percentage of a household’s income than owning one. According to the analysis, here’s the percentage of income homebuyers and renters should expect to pay now versus at the end of the year.While the principal and interest of a monthly mortgage payment remain the same over the lifetime of the loan, rents increase almost every year.
Real Estate: It’s Still a Lack of Supply, Not a Lack of Demand | North Scottsdale Real Estate & Luxury Homes | Team Picarello


  1. Owners build their wealth. Renters build their landlord’s wealth.

Whether you’re a homeowner or an investor, real estate builds wealth through growing equity year-over-year. If you own, your household is gaining the benefit of that wealth accumulation. Fleming says:

“The major financial advantage of homeownership is the accumulation of equity in the form of house price appreciation . . . . We have to take into account the fact that the shelter that you’re owning is an equity-generating or wealth-generating asset.”

Odeta Kushi, Deputy Chief Economist at First American, elaborates in a recent article:

“. . . once the home is purchased, appreciation helps build equity in the home, and becomes a benefit rather than a cost. When accounting for the appreciation benefit in our rent versus own analysis, it was cheaper to own in every one of the top 50 markets, including the two most expensive rental markets, San Francisco and San Jose, Calif.”

Today, that equity buildup is substantial. The National Association of Realtors (NAR) reports:

“The median sales price of single-family existing homes rose in 99% of measured metro areas in the second quarter of 2021 compared to one year ago, with double-digit price gains in 94% of markets.”

In 94% of markets, there was a greater than 10% increase in median price. That means if you bought a $400,000 home in one of those markets, your net worth increased by at least $40,000. If you rented, the landlord was the recipient of the wealth increase.

Bottom Line

For many reasons, housing demand is still extremely strong. What we need is more supply (house listings) to meet that demand.

Are Houses Less Affordable Than They Were in Past Decades?

There are many headlines about how housing affordability is declining. The headlines are correct: it’s less affordable to purchase a home today than it was a year ago. However, it’s important to give this trend context. Is it less expensive to buy a house today than it was in 2005? What about 1995? What happens if we go all the way back to 1985? Or even 1975?

Obviously, the price of a home has appreciated dramatically over the last 45 years. So have the prices of milk, bread, and just about every other consumable. Prices rise over time – we know it as inflation.

However, when we look at housing, price is just one component that makes up the monthly cost of the home. Another key factor is the mortgage rate at the time of purchase.

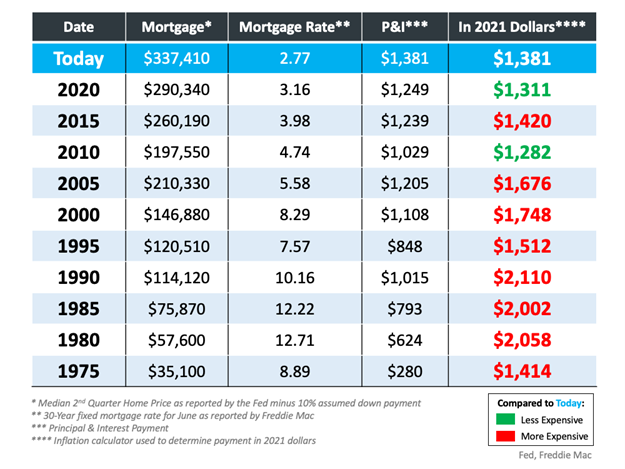
Let’s look back at the cost of a home over the last five decades and adjust it for inflation by converting that cost to 2021 dollars. Here’s the methodology for each data point of the table below:
• Mortgage Amount: Take the median sales price at the end of the second quarter of each year as reported by the Fed and assume that the buyer made a 10% down payment.
• Mortgage Rate: Look at the monthly 30-year fixed rate for June of that year as reported by Freddie Mac.
• P&I: Use a mortgage calculator to determine the monthly principal and interest on the loan.
• In 2021 Dollars: Use an inflation calculator to determine what each payment would be when adjusted for inflation. Green means the homes were less expensive than today. Red means they were more expensive.

Are Houses Less Affordable Than They Were in Past Decades? | North Scottsdale Real Estate & Luxury Homes | Team Picarello
As the chart shows, when adjusted for inflation, there were only two times in the last 45 years that it was less expensive to own a home than it is today.
1. Last year: Prices saw strong appreciation over the last year and mortgage rates have remained relatively flat. Therefore, affordability weakened.
2. 2010: Home values plummeted after the housing crash 15 years ago. One-third of all sales were distressed properties (foreclosures or short sales). They sold at major discounts and negatively                impacted the value of surrounding homes – of course homes were more affordable then.

At every other point, even in 1975, it was more expensive to buy a home than it is today.

Bottom Line
If you want to buy a home, don’t let the headlines about affordability discourage you. You can’t get the deal your friend got last year, but you will get a better deal than your parents did 20 years ago and your grandparents did 40 years ago.

June 2021 Market Update

Note: June 2021 data below are the most recent released by the National Association of Realtors.

Existing-home sales increased in June, snapping four consecutive months of declines, according to the National Association of Realtors®. Three of the four major U.S. regions registered small month-over-month gains, while the fourth remained flat. However, all four areas notched double-digit year-over-year gains.

Total existing-home sales (transactions that include single-family homes, townhomes, condominiums and co-ops) grew 1.4% from May to a seasonally adjusted annual rate of 5.86 million in June. Sales climbed year-over-year, up 22.9% from a year ago (4.77 million in June 2020).

National Association of Realtors June 2021 Data

"Supply has modestly improved in recent months due to more housing starts and existing homeowners listing their homes, all of which has resulted in an uptick in sales," said Lawrence Yun, NAR's chief economist. "Home sales continue to run at a pace above the rate seen before the pandemic."

Total housing inventory at the end of June amounted to 1.25 million units, up 3.3% from May's inventory and down 18.8% from one year ago (1.54 million). Unsold inventory sits at a 2.6-month supply at the current sales pace, modestly up from May's 2.5-month supply but down from 3.9 months in June 2020.

The median existing-home price for all housing types in in June was $363,300, up 23.4% from June 2020 ($294,400), as every region recorded price jumps. This marks 112 straight months of year-over-year gains.

"At a broad level, home prices are in no danger of a decline due to tight inventory conditions, but I do expect prices to appreciate at a slower pace by the end of the year," Yun said. "Ideally, the costs for a home would rise roughly in line with income growth, which is likely to happen in 2022 as more listings and new construction become available."

Properties typically remained on the market for 17 days in June, unchanged from May and down from 24 days in June 2020. Eighty-nine percent of homes sold in June 2021 were on the market for less than a month.

First-time buyers were responsible for 31% of sales in June, also even with May but down from 35% in June 2020. NAR's 2020 Profile of Home Buyers and Sellers revealed that the annual share of first-time buyers was 31%.

Individual investors or second-home buyers, who account for many cash sales, purchased 14% of homes in June, down from 17% in May and up from 9% in June 2020. All-cash sales accounted for 23% of transactions in June, even with May and up from 16% in June 2020.

"Huge wealth gains from both housing equity and the stock market have nudged up all-cash transactions, but first-time buyers who need mortgage financing are being uniquely challenged with record-high home prices and low inventory," Yun explained. "Although rates are favorably low, these hurdles have been overwhelming to some potential buyers."
 
According to Freddie Mac, the average commitment rate for a 30-year, conventional, fixed-rate mortgage was 2.98% in June, slightly up from 2.96% in May. The average commitment rate across all of 2020 was 3.11%.

"NAR continues our conversations with policymakers and leaders from across the industry in an effort to boost housing inventory and increase access to safe, affordable housing for all Americans," said NAR President Charlie Oppler, a Realtor® from Franklin Lakes, N.J., and the CEO of Prominent Properties Sotheby's International Realty. "As the nation's economy continues to recover from COVID-19, securing policies that are in the best interest of U.S. consumers and homeowners remains NAR's priority."

A Look at Housing Supply and What It Means for Sellers

One of the hottest topics of conversation in today’s real estate market is the shortage of available homes. Simply put, there are many more potential buyers than there are homes for sale. As a seller, you’ve likely heard that low supply is good news for you. It means your house will get more attention, and likely, more offers. But as life begins to return to normal, you may be wondering if that’s something that will change.

While it may be tempting to blame the pandemic for the current inventory shortage, the pandemic can’t take all the credit. While it did make some sellers hold off on listing their houses over the past year, the truth is the low supply of homes was years in the making. Let’s take a look at the root cause and what the future holds to uncover why now is still a great time to sell.

Where Did the Shortage Come From?

It’s not just today’s high buyer demand. Our low supply goes hand-in-hand with the number of new homes built over the past decades. According to Sam Khater, VP and Chief Economist at Freddie Mac:

“The main driver of the housing shortfall has been the long-term decline in the construction of single-family homes.”

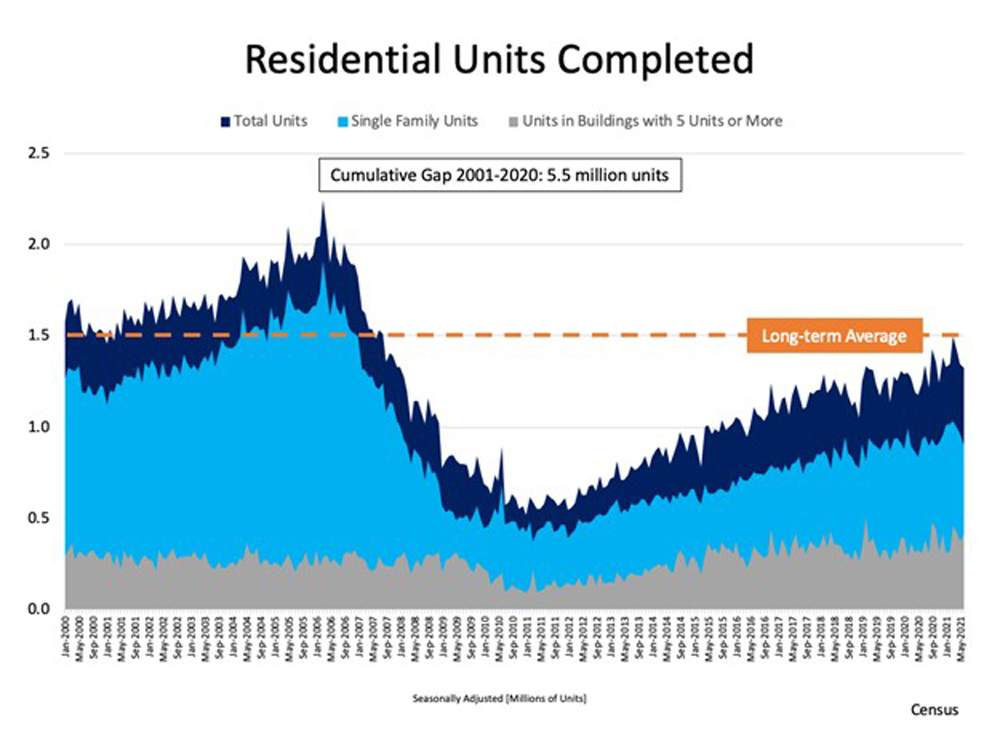
Data in a recent report from the National Association of Realtors (NAR) tells the same story. New home construction has been lagging behind the norm for quite some time. Historically, builders completed an average of 1.5 million new housing units per year. However, since the housing bubble in 2008, the level of new home construction has fallen off (see graph below):

A Look at Housing Supply and What It Means for Sellers | North Scottsdale Real Estate & Luxury Homes | Team Picarello

The same NAR report elaborates on the impact of this below-average pace of construction:

“. . . the underbuilding gap in the U.S. totaled more than 5.5 million housing units in the last 20 years.” 

“Looking ahead, in order to fill an underbuilding gap of approximately 5.5 million housing units during the next 10 years, while accounting for historical growth, new construction would need to accelerate to a pace that is well above the current trend, to more than 2 million housing units per year. . . .”

That means if we build even more new houses than the norm every year, it’ll still take a decade to close the underbuilding gap contributing to today’s supply-and-demand mix. Does that mean today’s ultimate sellers’ market is here to stay?

We’re already starting to see an increase in new home construction, which is great news. But newly built homes can’t bridge the supply gap we’re facing right now on their own. In the State of the Nation’s Housing 2021 Report, the Joint Center for Housing Studies of Harvard University (JCHS) says:

“…Although part of the answer to the nation’s housing shortage, new construction can only do so much to ease short-term supply constraints. To meet today’s strong demand, more existing single-family homes must come on the market.”

Early Indicators Show More Existing-Home Inventory Is on Its Way

When we look at existing homes, the latest reports signal that housing supply is growing gradually month-over-month. This uptick in existing homes for sale shows things are beginning to shift. Based on recent data, Odeta Kushi, Deputy Chief Economist at First American, has this to say:

“It looks like existing inventory is starting to inch up, which is good news for a housing market parched for more supply.”

Lawrence Yun, Chief Economist at NAR, echoes that sentiment:

“As the inventory is beginning to pick up ever so modestly, we are still facing a housing shortage, but we may have turned a corner.”

So, what does all of this mean for you? Just because life is starting to return to normal, it doesn’t mean you missed out on the best time to sell. It’s not too late to take advantage of today’s sellers’ market and use rising equity and low interest rates to make your next move.

Bottom Line

It’s still a great time to sell. Even though housing supply is starting to trend up, it’s still hovering near historic lows. Let’s connect to discuss how you can list your house now and use the inventory shortage to get the best possible terms for you.

4 Major Incentives To Sell This Summer

While the housing market forecast for the second half of the year remains positive, there may not be a better time to sell than right now. Here are four things to consider if you’re trying to decide if now’s the right time to make a move.

  1. Your House Will Likely Sell Quickly

According to the most recent Realtors Confidence Index released by the National Association of Realtors (NAR), homes continue to sell quickly. The report notes homes are selling in an average of just 17 days.

Average days on market is a strong indicator of buyer competition, and homes selling quickly is a great sign for sellers. It’s one of several factors that indicate buyers are motivated to do what it takes to purchase the home of their dreams.

  1. Buyers Are Willing To Compete for Your House

In addition to selling fast, homes are receiving multiple offers. NAR reports sellers are seeing an average of 5 offers, and these offers are competitive ones. Shawn Telford, Chief Appraiser at CoreLogic, said in a recent interview:

“The frequency of buyers being willing to pay more than the market data supports is increasing.”

This confirms buyers are ready and willing to enter bidding wars for your home. Receiving several offers on your house means you can select the one that makes the most sense for your situation and financial well-being.

  1. When Supply Is Low, Your House Is in the Spotlight

One of the most significant challenges for motivated buyers is the current inventory of homes for sale, which while improving, remains at near-record lows. As NAR details:

“Total housing inventory at the end of May amounted to 1.23 million units, up 7.0% from April’s inventory and down 20.6% from one year ago (1.55 million). Unsold inventory sits at a 2.5-month supply at the present sales pace, marginally up from April’s 2.4-month supply but down from 4.6-months in May 2020.”

There are signs, however, that more homes are coming to market. Odeta Kushi, Deputy Chief Economist at First American, notes:

“It looks like existing inventory is starting to inch up, which is good news for a housing market parched for more supply.”

If you’re looking to take advantage of buyer demand and get the most attention for your house, selling now before more listings come to the market might be your best option.

  1. If You’re Thinking of Moving Up, Now May Be the Time

Over the past 12 months, homeowners have gained a significant amount of wealth through growing equity. In that same period, homeowners have also spent a considerable amount of time in their homes, and many have decided their house doesn’t meet their needs.

If you’re not happy with your current home, you can leverage that equity to power your move now. Your equity, plus current low mortgage rates, can help you maximize your purchasing power.

But these near-historic low rates won’t last forever. Experts forecast interest rates will increase in the coming months. Nadia Evangelou, Senior Economist and Director of Forecasting at NAR, says:

“Nevertheless, as the economic outlook for the United States looks brighter for the rest of the year, mortgage rates are expected to rise in the following months.”

As interest rates rise, even modestly, it could influence buyer demand and your purchasing power. If you’ve been waiting for the best time to sell to fuel your move up, you likely won’t find more favorable conditions than those we’re seeing today.

Bottom Line

With supply challenges, low mortgage rates, and extremely motivated buyers, sellers are well-positioned to take advantage of current market conditions right now. If you’re thinking about selling, let’s connect today to discuss why it makes sense to list your home sooner rather than later.

May 2021 Market Update

Note: May 2021 data below are the most recent released by the National Association of Realtors.

Existing-home sales decreased for a fourth straight month in May, according to the National Association of Realtors®. Only one major U.S. region recorded a month-over-month increase, while the other three regions saw sales decline. However, each of the four areas again registered double-digit year-over-year gains.

Total existing-home sales (transactions that include single-family homes, townhomes, condominiums and co-ops) dropped 0.9% from April to a seasonally-adjusted annual rate of 5.80 million in May. Sales in total climbed year-over-year, up 44.6% from a year ago (4.01 million in May 2020).

National Association of Realtors May 2021 Data

"Home sales fell moderately in May and are now approaching pre-pandemic activity," said Lawrence Yun, NAR's chief economist. "Lack of inventory continues to be the overwhelming factor holding back home sales, but falling affordability is simply squeezing some first-time buyers out of the market.
 
"The market's outlook, however, is encouraging," Yun continued. "Supply is expected to improve, which will give buyers more options and help tamp down record-high asking prices for existing homes."

The median existing-home price for all housing types in May was $350,300, up 23.6% from May 2020 ($283,500), as every region registered price increases. This is a record high and marks 111 straight months of year-over-year gains since March 2012.

Total housing inventory at the end of May amounted to 1.23 million units, up 7.0% from April's inventory and down 20.6% from one year ago (1.55 million). Unsold inventory sits at a 2.5-month supply at the present sales pace, marginally up from April's 2.4-month supply but down from 4.6-months in May 2020.

Properties typically remained on the market for 17 days in May, unchanged from April and down from 26 days in May 2020. Eighty-nine percent of the homes sold in May 2021 were on the market for less than a month.

First-time buyers were responsible for 31% of sales in May, also even with April but down from 34% in May 2020. NAR's 2020 Profile of Home Buyers and Sellers revealed that the annual share of first-time buyers was 31%.

Individual investors or second-home buyers, who account for many cash sales, purchased 17% of homes in May, even with April and up from 14% in May 2020. All-cash sales accounted for 23% of transactions in May, down from 25% in April and up from 17% in May 2020.

A new study released by NAR last week – the 2021 Vacation Home Counties Report – found that from January to April 2021, the share of vacation home sales to total existing-home sales rose to 6.7%. Vacation home sales jumped 57.2% year-over-year compared to the 20% year-over-year growth in total existing-home sales.
 
"The appeal of vacation homes has certainly grown during the pandemic, especially among employees permitted to work from home," Yun said. "As businesses decide new guidelines for remote workers, even allowing permanent remote options in some cases, look for vacation homes to remain a popular option."
 
According to Freddie Mac, the average commitment rate for a 30-year, conventional, fixed-rate mortgage was 2.96% in May, down from 3.06% in April. The average commitment rate across all of 2020 was 3.11%. Yun expects the 30-year fixed-rate mortgage to remain below 3.5% in 2021.


A Look at Home Price Appreciation Through 2025

Home prices have increased significantly over the last year, which in turn has grown the net worth of homeowners. Appreciation and home equity are directly linked – as the value of a home increases, so does a homeowner’s equity. And with these recent gains, homeowners are witnessing their financial stability and well-being grow to record levels.

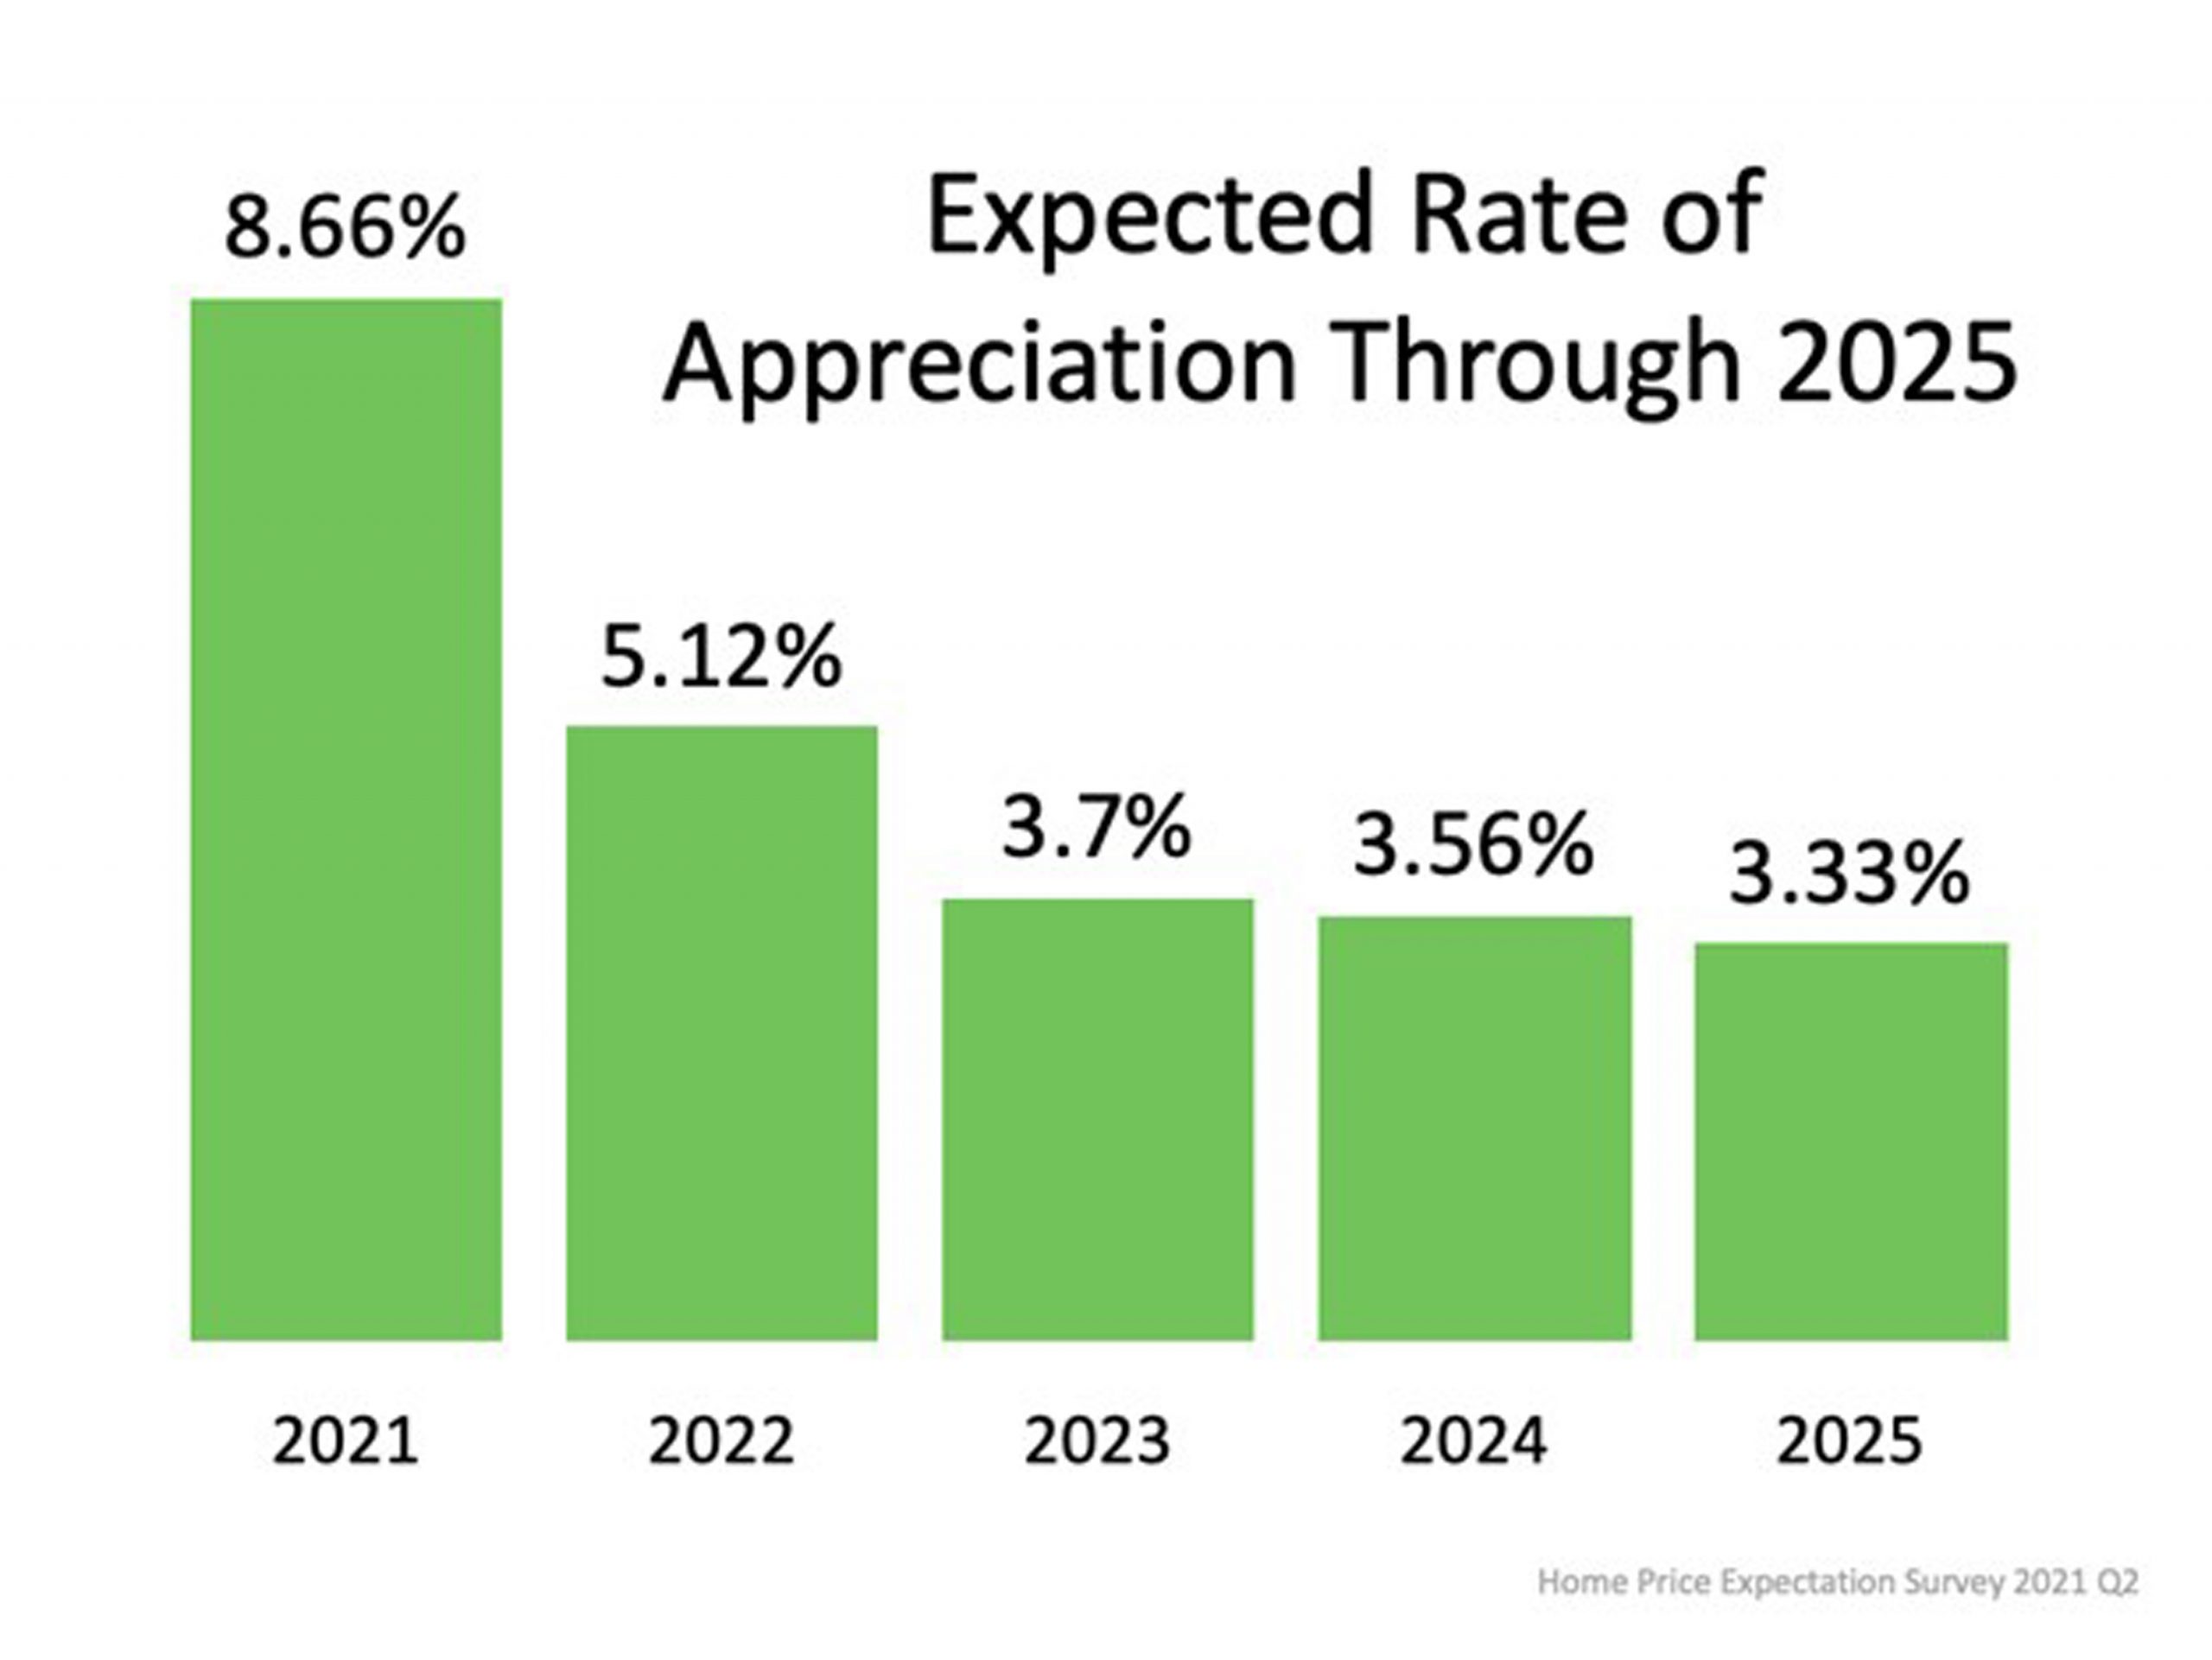
In more good news for homeowners, the most recent Home Price Expectations Survey – a survey of a national panel of over one hundred economists, real estate experts, and investment and market strategists – forecasts home prices will continue appreciating over the next five years, adding to the record amount of equity homeowners have already gained over the past year. Below are the expected year-over-year rates of home price appreciation from the report:

A Look at Home Price Appreciation Through 2025 | North Scottsdale Real Estate & Luxury Homes | Team Picarello

What Does This Mean for Homeowners?

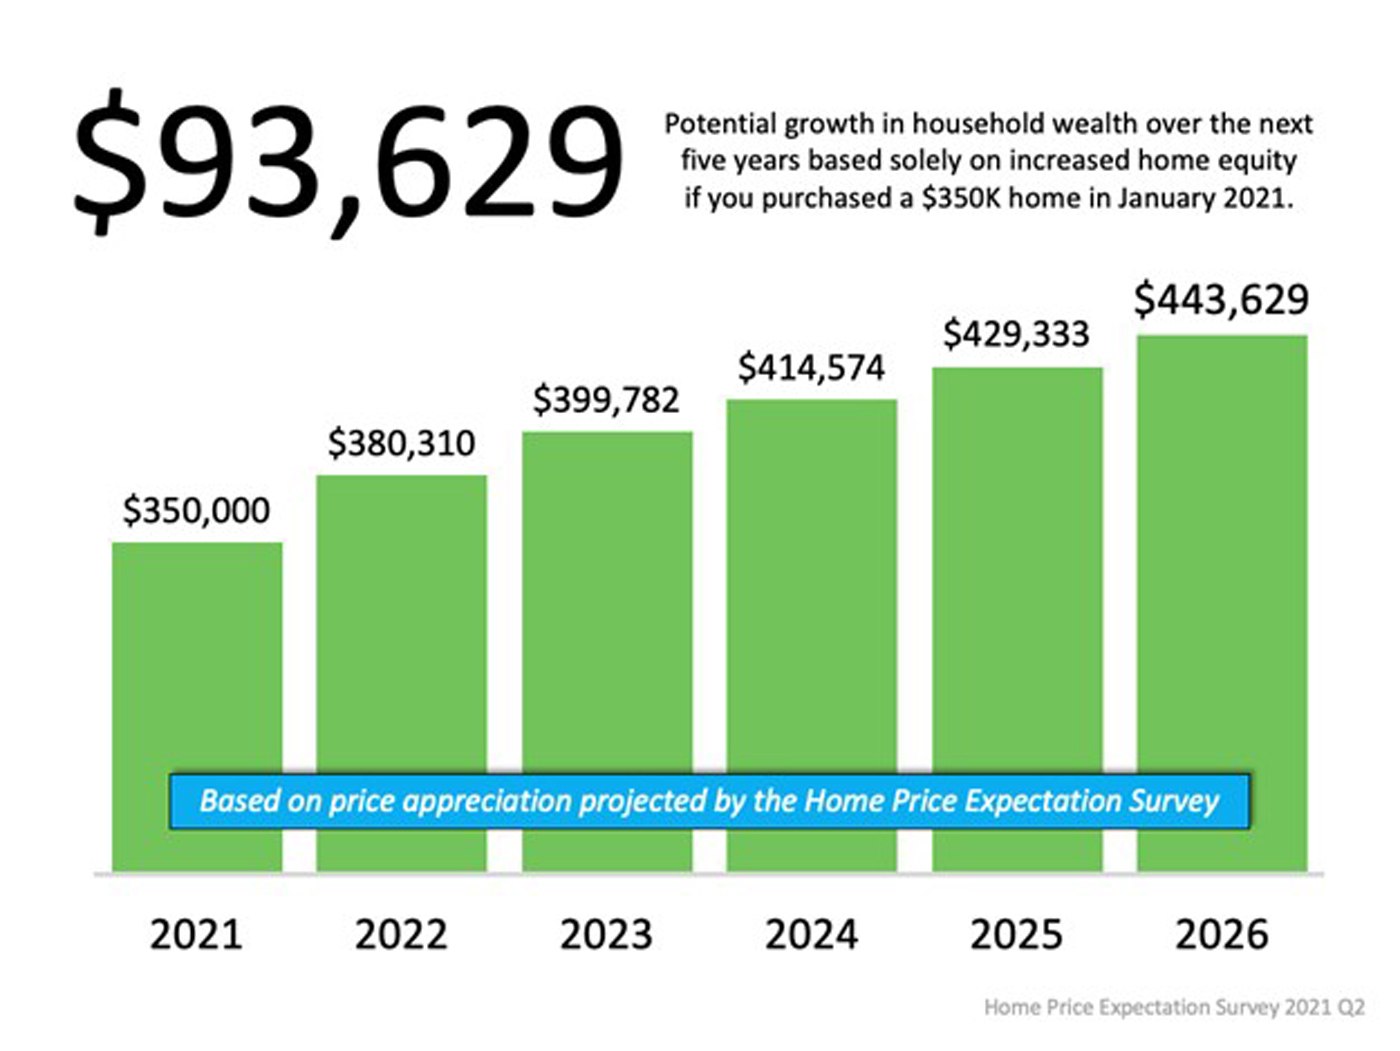
Home prices are climbing today, and the data in the survey indicates they’ll continue to increase, but at rates that approach a more normal pace. Even still, the amount of household wealth a homeowner stands to earn going forward is substantial. This truly becomes clear when we consider a scenario using a median-priced home purchased in January of 2021 and the projected rate of appreciation on that home over the next five years. As the graph below illustrates, a homeowner could increase their net worth by a significant amount – over $93,000 dollars by 2026.

A Look at Home Price Appreciation Through 2025 | North Scottsdale Real Estate & Luxury Homes | Team Picarello

Home Price Appreciation and Home Equity

CoreLogic recently released their quarterly Homeowner Equity Insights Report, which tracks the year-over-year increases in equity. It shows an average annual gain of $33,400 per borrower over the past 12 months. In the report, Dr. Frank Nothaft, Chief Economist for CoreLogic, further explains:

“Double-digit home price growth in the past year has bolstered home equity to a record amount. The national CoreLogic Home Price Index recorded an 11.4% rise in the year through March 2021, leading to a $216,000 increase in the average amount of equity held by homeowners with a mortgage.”

The expected, sustained growth of home prices means homeowners can continue to build on the past year’s record levels of home equity – and their financial prosperity. It also presents today’s homeowners with a unique opportunity: using their growing equity for a home upgrade. With so few homes available to purchase and strong buyer demand, there may not be a better time to sell your current house and move into one that better meets your needs.

Bottom Line

Home prices are expected to continue appreciating over the next five years, and the associated equity gains are the quickest way homeowners can build household wealth. If you’re a current homeowner who’s ready to take advantage of your built-up equity, let’s connect today to discuss your options.